
Bildirt’s performance and analytics screens allow you to track the overall status of your push notifications and delivery results in a simple and clear way.
In this section, we explain what all the metrics on the application dashboard and notification detail screens mean.
Application Dashboard Overview Metrics
On the main application dashboard, you can find key metrics that summarize your push notification performance.
- Total Subscribers: Total number of subscribers collected for your application to date
- Active Subscribers: Number of subscribers who can currently receive notifications
- Total Notifications: Total number of notifications sent from the application
- Total Clicks: Total number of clicks generated from all notifications
- Last 30 Days Clicks: Total number of clicks generated in the last 30 days
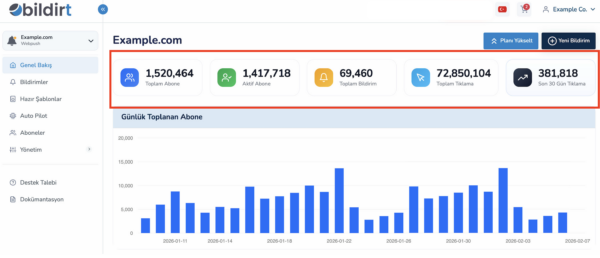
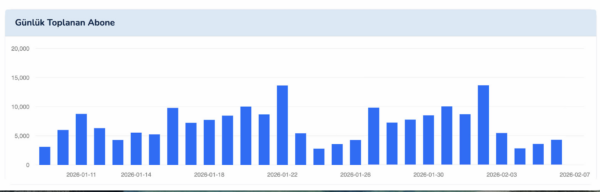
Daily Subscriber Growth Chart
The chart in the middle of the dashboard shows the number of new subscribers collected each day over the last 30 days.
- Helps you track subscriber growth trends
- Useful for analyzing the impact of campaigns or content
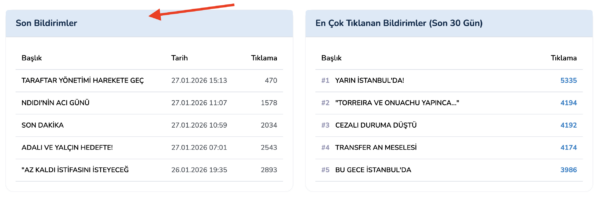
Recent Notifications
The Recent Notifications section lists the most recently sent push notifications from the application.
- Notification title
- Delivery date
- Number of clicks received
This list provides a quick overview of your latest deliveries.
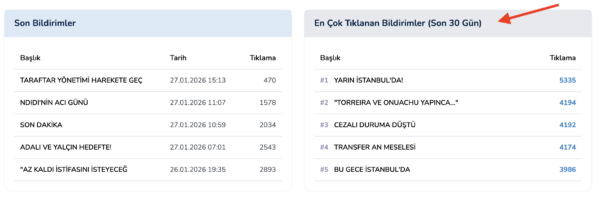
Top Clicked Notifications (Last 30 Days)
This section lists the push notifications that received the highest number of clicks in the last 30 days.
- Helps identify high-performing titles
- Provides reference for reusing similar content
Last 30 Days Daily Notification and Click Statistics
At the bottom of the dashboard, you can view a list showing the number of notifications sent and total clicks received each day over the last 30 days.
- Daily number of notifications sent
- Daily total click count
This table allows you to analyze the relationship between sending volume and engagement.
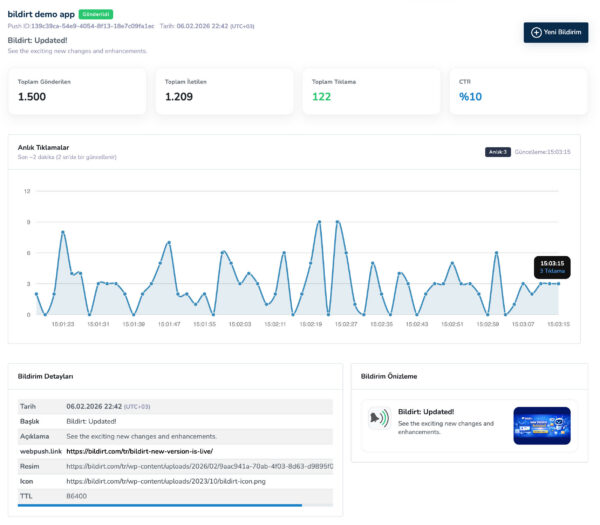
Notification Detail Analytics
When you open the details of a specific notification, you can view performance data specific to that notification.
- Total Sent: Number of subscribers the notification was sent to
- Total Delivered: Number of subscribers who successfully received the notification
- Total Clicks: Number of clicks generated from the notification
- CTR: Click-through rate
The detail screen also includes a real-time chart showing click activity after the notification is sent.
How to Interpret the Data?
- Reuse notification titles that generate high click rates
- Analyze days with high sending volume but low click performance
- Regularly review the last 30 days data to track trends
Next Step
After reviewing performance and analytics data, you may want to use Bildirt alongside other platforms.
In the next section, we will cover Integrations.